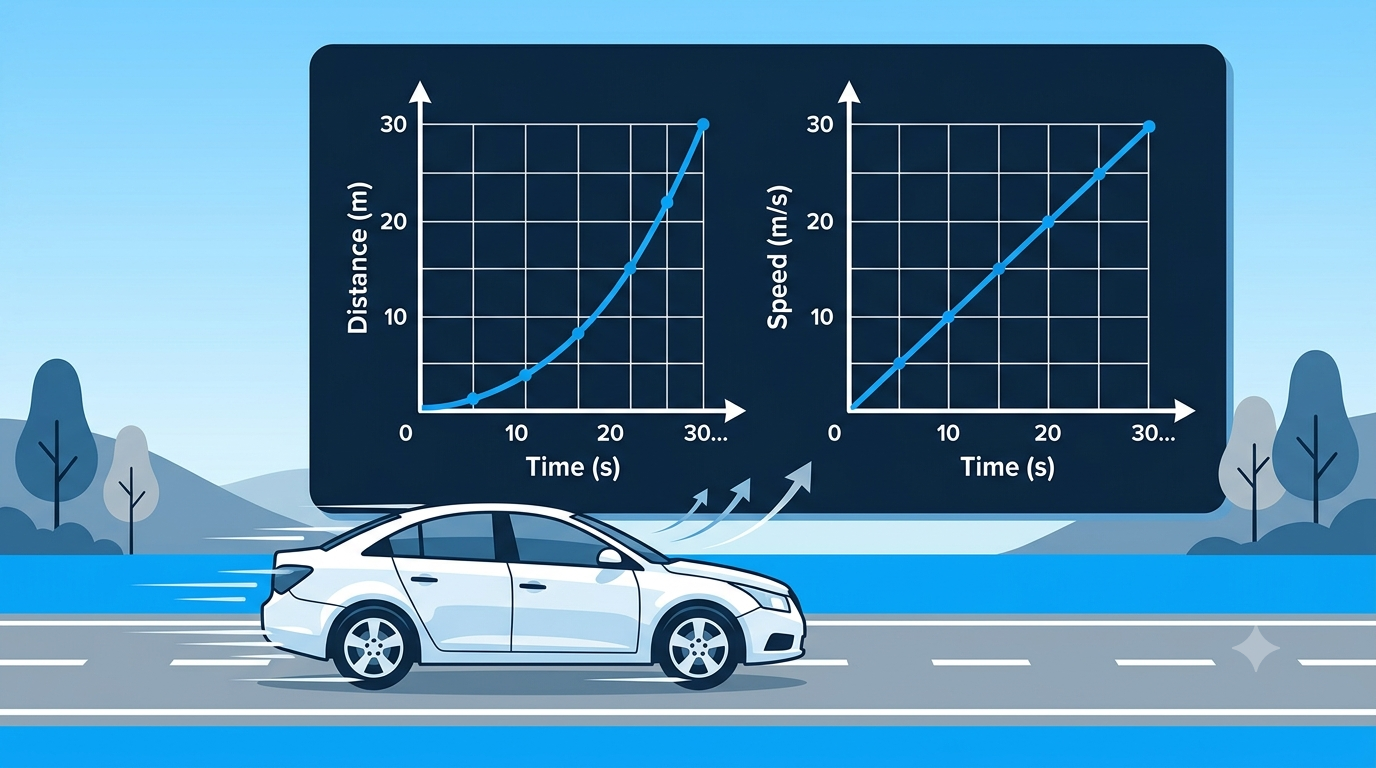
Motion is one of the most important ideas in physics. We see motion everywhere around us. A car travels along a road, a ball falls toward the ground, a cyclist changes speed, and a spacecraft moves through space. Although we can describe these movements using words and numbers, graphs often make motion much easier to understand.
A graph can turn a collection of measurements into a clear visual picture. Instead of reading many values separately, we can quickly see how an object moves, whether it is speeding up or slowing down, and how different quantities are related. This is why graphs are such an important tool in physics.
What Is a Motion Graph?
A motion graph is a graphical representation of how an object’s motion changes. Usually, one physical quantity is placed on the horizontal axis and another is placed on the vertical axis.
For example, in a distance-time graph, time is usually shown on the horizontal axis and distance on the vertical axis. Each point on the graph represents the distance traveled by an object at a particular time.
Suppose a car travels 10 meters in one second, 20 meters in two seconds, and 30 meters in three seconds. Writing these values in a table gives us useful information. But plotting them on a graph immediately shows a pattern. The points form a straight line, indicating that the car is covering equal distances in equal intervals of time.
This visual pattern is one of the biggest advantages of graphs.
Graphs Make Patterns Easier to See
One major reason graphs are useful is that they help us recognize patterns quickly.
Imagine recording the position of a moving object every second. You might have ten or twenty measurements. Looking at all those numbers individually can make it difficult to understand what is happening.
When the same data is plotted on a graph, the overall behavior becomes much clearer.
A straight line can show uniform motion. A curved line can indicate that the motion is changing. A graph that becomes steeper may show that an object is moving faster. A graph that becomes less steep may indicate that the object is slowing down.
In this way, a graph allows us to understand the behavior of an object without examining every measurement separately.
Distance-Time Graphs Show How Position Changes
A distance-time graph is one of the simplest and most useful graphs for studying motion.
Time is placed on the horizontal axis, while distance is placed on the vertical axis. The slope, or steepness, of the graph tells us about the object’s speed.
If the graph is a straight line with a constant slope, the object is moving at a constant speed.
If the line is horizontal, the distance is not changing with time. This means the object is stationary.
If the line becomes steeper, the object is covering more distance in the same amount of time. Therefore, its speed is increasing.
A curved distance-time graph can therefore provide information about changing motion that might be difficult to notice from a table of numbers.
Speed-Time Graphs Give More Information
Another important graph is the speed-time graph. Here, time is placed on the horizontal axis and speed is placed on the vertical axis.
This graph helps us understand how an object’s speed changes over time.
For example, if a horizontal line appears above the time axis, the object is moving at constant speed. If the line slopes upward, the speed is increasing. If it slopes downward, the speed is decreasing.
A speed-time graph can also help us understand acceleration. The slope of a speed-time graph represents acceleration when the motion is described appropriately.
This means one simple graph can show whether an object is accelerating, moving at constant speed, or slowing down.
Graphs Help Us Compare Different Motions
Graphs are also useful when comparing two or more objects.
Suppose two cars are traveling along the same road. Their motion can be represented on the same graph. By comparing the lines, we can determine which car travels farther, which moves faster, or whether their motions change differently over time.
For example, on a distance-time graph, the steeper line represents greater speed. This makes comparison much easier than reading separate tables of numbers.
Graphs are particularly valuable when experiments involve several objects or repeated measurements.
Graphs Help Turn Data Into Meaning
Physics experiments often produce a large amount of numerical data. Scientists need a way to interpret that data and identify relationships between physical quantities.
Graphs provide that connection.
Consider an experiment measuring the distance traveled by a moving object at different times. The raw measurements are useful, but the graph can reveal whether distance changes proportionally with time.
Similarly, an experiment can use graphs to investigate relationships between force and acceleration, voltage and current, or mass and weight.
Instead of simply collecting numbers, scientists can use graphs to determine how quantities are connected.
The Slope of a Graph Can Represent a Physical Quantity
One of the most powerful features of graphs in physics is that the slope often has physical meaning.
The slope is found by comparing the change in the vertical quantity with the change in the horizontal quantity.
For a distance-time graph, this relationship gives speed:
Speed = Change in distance ÷ Change in time
For a velocity-time graph, the slope can represent acceleration:
Acceleration = Change in velocity ÷ Change in time
This means a graph is not merely a picture of data. It can also provide a way to calculate important physical quantities.
The steepness of a line therefore has a direct connection with physical behavior.
The Area Under a Graph Can Also Be Important
Graphs can provide information through their area as well as their slope.
For example, the area under a velocity-time graph represents displacement over a given time interval.
This is particularly useful when velocity is changing. Instead of calculating displacement separately for many small time intervals, we can use the area under the graph to determine the overall displacement.
This shows how graphs can transform complicated motion into something that can be analyzed visually and mathematically.
Graphs Make Changing Motion Easier to Understand
Not all objects move at constant speed.
A vehicle may accelerate when a traffic signal turns green, maintain a steady speed on a highway, and slow down when approaching another vehicle. A falling object may also change its velocity as it moves.
Describing all these changes using words can become complicated.
A graph can show the entire motion in a single visual representation. Changes in slope, curves, rising sections, falling sections, and horizontal sections can each provide information about what the object is doing.
This makes graphs especially useful for understanding non-uniform motion.
Graphs Help Scientists Analyze Experimental Results
Graphs are an essential part of scientific experiments.
When scientists measure motion, they rarely rely on a single observation. They collect multiple measurements and look for relationships. Plotting the data helps them identify trends, unusual measurements, and possible experimental errors.
For example, if most points follow a clear pattern but one point is far away from the others, scientists may investigate whether that measurement resulted from an error or represents something important.
Graphs can therefore help researchers understand both the expected behavior and unexpected results.
Graphs Connect Mathematics With Physics
Physics uses mathematics to describe nature, and graphs provide a natural connection between the two.
A mathematical equation can describe motion precisely, while a graph can show what that equation means visually.
For example, an equation describing constant speed can produce a straight line on a distance-time graph. An equation involving acceleration can produce a curved position-time relationship.
By learning to interpret graphs, students and researchers develop the ability to move between equations, numbers, and physical ideas.
Why Graphs Are Better Than Numbers Alone
Numbers provide precision, but they do not always make relationships obvious.
Imagine being given a table containing dozens of measurements. You may eventually understand what happened, but recognizing the overall trend could take time.
A graph organizes those numbers visually. The human brain is often very good at recognizing shapes, trends, and changes, so graphs can communicate information quickly.
This does not mean graphs replace numbers. Instead, graphs and numerical data work together. Numbers provide detailed measurements, while graphs reveal the bigger picture.
Conclusion
Graphs are useful for understanding motion because they turn numerical data into a visual description of how an object behaves.
Distance-time graphs help us understand changes in position and speed. Speed-time and velocity-time graphs show how motion changes over time. The slope of a graph can represent important quantities such as speed or acceleration, while the area under certain graphs can provide information about displacement.
Most importantly, graphs make patterns, trends, comparisons, and changes much easier to recognize. They allow us to connect observations with mathematical relationships and physical explanations.
Whether we are studying a moving car, a falling object, a spacecraft, or the results of a physics experiment, graphs give us a powerful way to see motion rather than simply calculate it. That is why learning to read and interpret graphs is an essential part of understanding physics.