The Cartesian coordinate system is one of the most important concepts in mathematics because it provides a simple way to describe the position of points on a flat surface. It helps us understand shapes, study geometric relationships, draw graphs, and solve mathematical problems using numbers. Instead of describing a location only through words, we can identify its exact position using an ordered pair of numbers.
This system is widely used in coordinate geometry, algebra, physics, computer graphics, engineering, navigation, and many other fields. For example, when we plot a point on a graph, locate an object on a digital screen, or represent the relationship between two quantities, we often use the principles of Cartesian coordinates. Understanding this system makes it easier to connect algebra with geometry and provides a foundation for learning more advanced mathematical topics.
What Is the Cartesian Coordinate System?
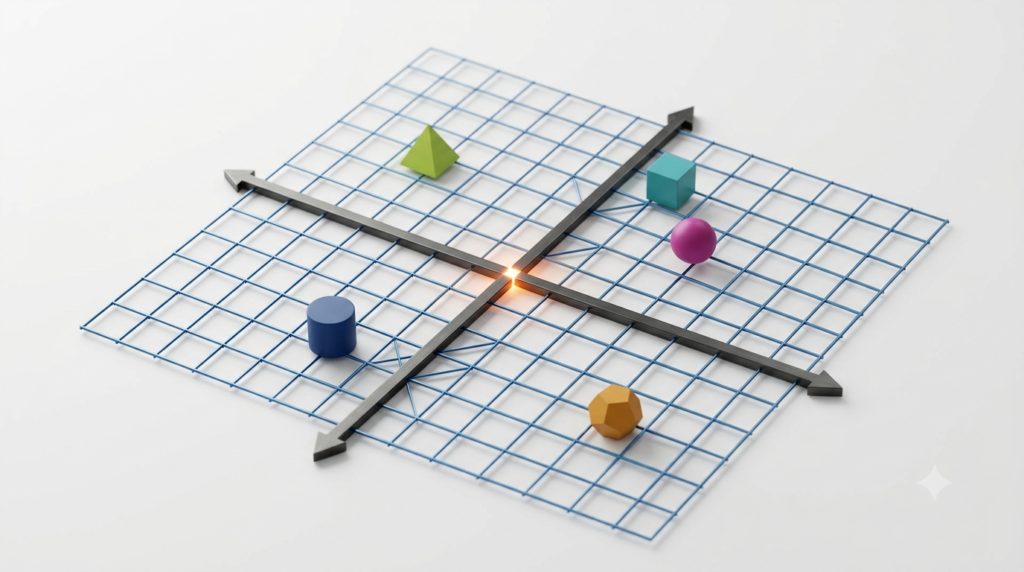
The Cartesian coordinate system is a method of identifying the position of a point using numerical coordinates measured from fixed reference lines. In a two-dimensional coordinate system, two perpendicular lines form the basic framework. These lines are called the x-axis and the y-axis.
The horizontal line is known as the x-axis, while the vertical line is called the y-axis. They intersect at a point called the origin, which represents the coordinate (0, 0).
Every point on the coordinate plane can be described using two numbers. The first number indicates the horizontal position, and the second number indicates the vertical position. Together, these numbers form an ordered pair.
For example, the point (3, 2) represents a position three units to the right of the origin and two units above it.
The system is named after the French mathematician and philosopher René Descartes, who helped establish the connection between algebra and geometry. This connection allows mathematical relationships to be represented visually through points, lines, curves, and graphs.
The Main Components of the Cartesian Coordinate System
To understand how the Cartesian coordinate system works, it is important to become familiar with its basic components.
1. The X-Axis
The x-axis is the horizontal reference line on the coordinate plane. It extends indefinitely in both directions.
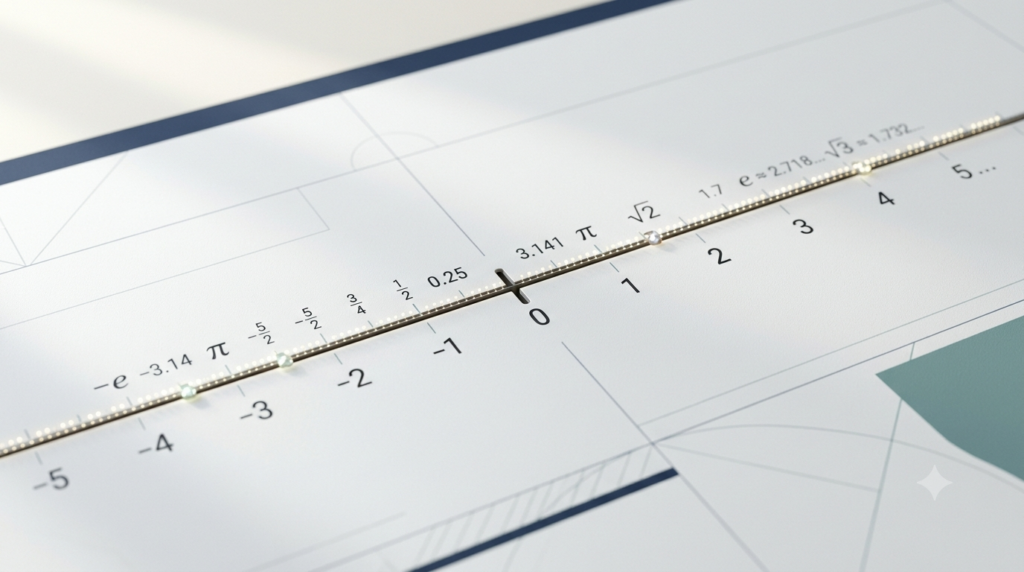
Values to the right of the origin are positive, while values to the left are negative. A point located directly on the x-axis has a y-coordinate of zero.
For example, the point (4, 0) lies four units to the right of the origin. Similarly, the point (-3, 0) lies three units to the left.
The x-axis is useful for representing horizontal positions and showing how one quantity changes along the horizontal direction of a graph.
2. The Y-Axis
The y-axis is the vertical reference line. It also extends indefinitely in both directions.
Values above the origin are positive, while values below it are negative. Any point located directly on the y-axis has an x-coordinate of zero.
For example, the point (0, 5) lies five units above the origin, while (0, -2) lies two units below it.
The y-axis helps represent vertical positions and is commonly used to show values such as distance, temperature, time-dependent measurements, and other quantities on graphs.
3. The Origin
The origin is the point where the x-axis and y-axis intersect. Its coordinates are always (0, 0).
It serves as the reference point for measuring horizontal and vertical distances on the coordinate plane. Every point is located relative to this fixed position.
For instance, to plot the point (2, 4), we begin at the origin, move two units to the right, and then move four units upward.
The origin is especially important because it separates positive and negative coordinate values along both axes.
4. Coordinates
Coordinates are numerical values that describe the position of a point on the coordinate plane.
In a two-dimensional Cartesian coordinate system, coordinates are written as an ordered pair:
Text block — Formula
(x, y)
Here, x represents the horizontal coordinate, and y represents the vertical coordinate.
For example, in the ordered pair (5, 3), the x-coordinate is 5 and the y-coordinate is 3.
The order of these numbers matters. The point (5, 3) is different from the point (3, 5) because their horizontal and vertical positions are reversed.
Coordinates allow us to communicate the exact position of points without relying on lengthy verbal descriptions.
5. The Coordinate Plane
The coordinate plane is the flat surface formed by the intersection of the x-axis and y-axis. It provides a space in which points, lines, shapes, and mathematical graphs can be represented.
The two axes divide the plane into four regions called quadrants. Each quadrant contains a different combination of positive and negative coordinate values.
The coordinate plane is the foundation of coordinate geometry because it allows geometric figures to be studied through numerical relationships.
Understanding the Four Quadrants
The x-axis and y-axis divide the coordinate plane into four quadrants. These quadrants are numbered counterclockwise, beginning with the upper-right region.
First Quadrant
The first quadrant is located in the upper-right region of the coordinate plane. Both coordinates are positive.
Text block — Coordinate signs
x > 0, y > 0
For example, the point (3, 4) belongs to the first quadrant because both coordinates are positive.
Second Quadrant
The second quadrant is located in the upper-left region. The x-coordinate is negative, while the y-coordinate is positive.
Text block — Coordinate signs
x < 0, y > 0
For example, (-2, 5) belongs to the second quadrant.
Third Quadrant
The third quadrant occupies the lower-left region. Both coordinates are negative.
Text block — Coordinate signs
x < 0, y < 0
For example, (-4, -3) belongs to the third quadrant.
Fourth Quadrant
The fourth quadrant is located in the lower-right region. The x-coordinate is positive, while the y-coordinate is negative.
Text block — Coordinate signs
x > 0, y < 0
For example, (6, -2) belongs to the fourth quadrant.
Points that lie directly on either axis do not belong to any quadrant. For instance, (4, 0) lies on the x-axis, and (0, -3) lies on the y-axis.
Remembering the sign combinations makes it easier to identify the location of any point on the coordinate plane.
How to Plot a Point on the Coordinate Plane
Plotting a point means marking its position on the coordinate plane using its coordinates. The process is straightforward once you understand the roles of the two axes.
Consider the point (4, 3).
First, locate the origin at (0, 0). Next, examine the first coordinate, which is 4. Move four units to the right along the horizontal direction. Then examine the second coordinate, which is 3. Move three units upward.
Mark the final position with a dot and label it (4, 3).
The same method works for points in other quadrants. For example, to plot (-3, 2), move three units to the left and two units upward. To plot (2, -4), move two units to the right and four units downward.
When plotting points, always follow the order of the coordinates: horizontal movement first, followed by vertical movement.
It is also important to maintain equal spacing between consecutive units on each axis. A consistent scale ensures that the graph represents positions accurately.
How to Read Coordinates from a Graph
Reading coordinates involves identifying the horizontal and vertical positions of a plotted point.
Begin by observing the point’s location relative to the origin. Determine its horizontal coordinate by moving conceptually toward the x-axis, then determine its vertical coordinate by comparing its position with the y-axis.
For example, suppose a point is located two units to the left of the origin and four units above it. Its coordinates are (-2, 4).
Similarly, a point three units to the right and two units below the origin has coordinates (3, -2).
Always read the horizontal coordinate first and the vertical coordinate second. Reversing the order changes the point’s position.
A graph may also use a scale in which each marked interval represents more than one unit. For example, each interval might represent five units. In such cases, read the scale carefully before identifying the coordinates.
Learning to read coordinates accurately is essential for interpreting graphs in mathematics and other subjects.
The Difference Between Two-Dimensional and Three-Dimensional Cartesian Coordinates
The Cartesian coordinate system can represent positions in both two-dimensional and three-dimensional space.
Two-Dimensional Coordinate System
A two-dimensional coordinate system uses two perpendicular axes: the x-axis and the y-axis.
Each point is represented by an ordered pair.
Text block — Formula
(x, y)
For example, (3, 5) identifies a point on a flat surface. This system is commonly used in coordinate geometry, graph plotting, maps, and diagrams.
Three-Dimensional Coordinate System
A three-dimensional Cartesian coordinate system introduces a third axis called the z-axis. This axis allows positions to be represented in three dimensions.
Each point is described using three coordinates.
Text block — Formula
(x, y, z)
Here, x represents the position along the first axis, y represents the position along the second axis, and z represents the position along the third axis.
For example, the point (2, 3, 4) identifies a location in three-dimensional space.
Three-dimensional coordinates are used in architecture, engineering, robotics, computer graphics, physics, and scientific modelling. They help describe objects that have length, width, and height.
The main difference is that a two-dimensional system describes positions on a plane, whereas a three-dimensional system describes positions in space.
The Purpose of the Cartesian Coordinate System
The Cartesian coordinate system serves several important purposes in mathematics and practical applications.
1. Locating Points Precisely
One of its primary purposes is to identify the exact position of a point. Coordinates provide a standard numerical description that can be understood and reproduced by anyone using the same coordinate system.
This is useful in mathematical diagrams, maps, digital interfaces, and scientific measurements.
2. Connecting Algebra and Geometry
The coordinate system creates a relationship between algebraic expressions and geometric figures.
For example, an equation can describe a straight line on a coordinate plane. By plotting points that satisfy the equation, we can visualize the relationship between its variables.
Text block — Formula
y = 2x + 1
This equation represents a straight line. When x = 0, y = 1. When x = 1, y = 3. These values produce points that can be plotted and connected to form the graph.
This connection allows mathematical problems to be approached using calculations as well as visual reasoning.
3. Drawing and Interpreting Graphs
Graphs help us understand relationships between quantities. The Cartesian coordinate system provides the framework for plotting data and displaying mathematical functions.
For example, a graph can show how the distance travelled by a vehicle changes with time. It can also illustrate relationships between temperature and time, price and quantity, or a variable and its corresponding value.
By studying the shape and direction of a graph, we can identify patterns, compare values, and understand how one quantity changes in relation to another.
4. Calculating Distances
Coordinates make it possible to calculate the distance between two points on a plane.
Suppose two points have coordinates (x₁, y₁) and (x₂, y₂). The distance between them can be calculated using the distance formula.
Text block — Formula
d = √[(x₂ − x₁)² + (y₂ − y₁)²]
The formula is based on the Pythagorean theorem. It combines the horizontal and vertical differences between the points to determine the straight-line distance.
For example, consider the points (1, 2) and (4, 6).
The horizontal difference is 4 − 1 = 3, and the vertical difference is 6 − 2 = 4.
Text block — Calculation
d = √(3² + 4²)
d = √(9 + 16)
d = √25 = 5 units
Therefore, the distance between the two points is five units.
This method is useful in geometry, navigation, physics, and computer graphics.
5. Studying Shapes and Geometric Figures
The Cartesian coordinate system makes it easier to analyse geometric figures through their vertices and other points.
For example, the corners of a rectangle can be represented using coordinates. These coordinates can then be used to calculate its side lengths, perimeter, and area.
Similarly, triangles, circles, polygons, and other figures can be represented and studied on the coordinate plane.
This approach is particularly useful in coordinate geometry, where algebraic methods are used to solve geometric problems.
6. Understanding Motion and Position
In physics, coordinates are used to describe the position of objects and changes in their location.
A moving object can be represented by different coordinate values at different times. By examining these values, scientists can study motion, displacement, and relationships between physical quantities.
In a two-dimensional model, an object’s position may be represented by x and y coordinates. A three-dimensional model can also include its vertical or depth-related position through the z-coordinate.
Coordinate systems therefore provide a mathematical language for describing movement and spatial relationships.
Real-Life Applications of the Cartesian Coordinate System
The Cartesian coordinate system is not limited to classroom mathematics. It plays an important role in many real-world activities and technologies.
1. Computer Graphics and Animation
Computer graphics use coordinate systems to determine the positions of pixels, shapes, objects, and visual elements.
On a computer screen, a point can be represented using horizontal and vertical coordinates. These values help software determine where an image or object should appear.
Three-dimensional graphics extend this idea by using three coordinates to represent objects in virtual space.
Animation systems also use coordinates to move objects between positions and create smooth motion.
2. Engineering and Architecture
Engineers and architects use coordinates when designing buildings, machines, structures, and technical drawings.
Coordinates help identify the positions of components, measure distances, and maintain accurate relationships between different parts of a design.
Computer-aided design software frequently uses coordinate-based methods to create and modify two-dimensional drawings and three-dimensional models.
3. Navigation and Mapping
Coordinate systems help represent locations on maps and in navigation applications.
However, it is important to understand that geographic coordinates, such as latitude and longitude, are not the same as ordinary Cartesian coordinates. They describe locations on the Earth’s curved surface using angular measurements.
Mapping software can transform geographic locations into suitable projected coordinate systems for measuring distances and displaying maps on flat screens.
The underlying idea is similar: numerical values provide a systematic way to identify locations.
4. Science and Research
Scientists use coordinate systems to organize measurements, represent experimental results, and describe spatial relationships.
In chemistry, physics, astronomy, and environmental science, coordinates can be used to describe the positions of objects or represent data visually.
Graphs based on Cartesian coordinates also help researchers identify trends, compare observations, and test mathematical models.
5. Robotics
Robots must identify the positions of objects, tools, joints, and destinations to perform tasks accurately.
Cartesian coordinates can describe where a robot should move or where a target is located. In many robotic systems, coordinate transformations are also required because the robot may use several reference frames.
These methods support tasks such as moving components, handling objects, and positioning tools during manufacturing.
Common Mistakes When Using Cartesian Coordinates
Although the Cartesian coordinate system is relatively simple, beginners sometimes make mistakes when plotting or interpreting points.
1. Reversing the Coordinates
The most common mistake is writing the vertical coordinate before the horizontal coordinate.
Remember that an ordered pair is always written as (x, y). The x-coordinate comes first, followed by the y-coordinate.
2. Moving in the Wrong Direction
Positive x-values indicate movement to the right, while negative x-values indicate movement to the left. Positive y-values indicate movement upward, while negative y-values indicate movement downward.
Confusing these directions can place a point in the wrong quadrant.
3. Forgetting the Origin
The origin is the reference point for both axes. Always begin plotting a point from (0, 0), unless the problem specifies another reference point.
4. Ignoring the Graph Scale
Not every graph uses one unit for each interval. If the scale changes, the plotted positions must reflect that scale.
Always check the labels and numerical markings on the axes before plotting or reading points.
5. Assigning Axis Points to a Quadrant
Points on the x-axis or y-axis do not belong to any of the four quadrants. For example, (0, 4) lies on the y-axis, while (-3, 0) lies on the x-axis.
Understanding these distinctions improves accuracy and helps prevent errors in coordinate geometry.
Why Is the Cartesian Coordinate System Important in Mathematics?
The Cartesian coordinate system is important because it turns geometric positions into numerical information that can be analysed mathematically.
It provides the foundation for many topics, including coordinate geometry, linear equations, functions, graph interpretation, distance calculations, and transformations.
Students who understand Cartesian coordinates can more easily connect algebraic equations with visual representations. Instead of viewing an equation only as a collection of symbols, they can understand how it describes a line or curve on a graph.
The system also encourages logical thinking and precision. Every point has a clear numerical representation, and relationships between points can be explored using calculations.
Beyond basic mathematics, Cartesian coordinates support advanced topics such as calculus, vector analysis, computer graphics, and mathematical modelling.
For these reasons, learning the Cartesian coordinate system is an essential step toward understanding how mathematics describes space, patterns, and relationships.
Conclusion
The Cartesian coordinate system provides a systematic way to describe the position of points using numerical coordinates. Its two-dimensional form consists of the x-axis, y-axis, origin, and four quadrants, while its three-dimensional form adds a z-axis to represent positions in space. By learning how to read and plot coordinates, students can develop a strong foundation in coordinate geometry and graph interpretation.
The system also connects algebra with geometry, allowing equations to be represented visually and geometric relationships to be analysed through calculations. Its applications extend to physics, engineering, computer graphics, robotics, mapping, and scientific research. Understanding the Cartesian coordinate system is therefore valuable not only for solving mathematical problems but also for recognizing how numerical descriptions of position are used in everyday life and modern technology.
FAQs
1. What is the Cartesian coordinate system?
The Cartesian coordinate system is a mathematical system used to identify the exact position of points using numerical coordinates. In a two-dimensional system, it consists of two perpendicular lines called the x-axis and y-axis. These lines intersect at a point known as the origin, represented by (0, 0). Every point on the coordinate plane is described using an ordered pair (x, y), where x represents the horizontal position and y represents the vertical position. This system is widely used in coordinate geometry, algebra, graph plotting, physics, engineering, and computer graphics to represent positions and mathematical relationships accurately.
2. Why is the Cartesian coordinate system important?
The Cartesian coordinate system is important because it connects algebra with geometry and provides a reliable way to represent mathematical information visually. It allows us to locate points, draw graphs, calculate distances, and study geometric shapes using numerical values. Students use it to understand equations, functions, and coordinate geometry. Scientists and engineers apply coordinate systems to describe positions, analyse measurements, and develop mathematical models. Computer graphics and animation also rely on coordinates to position objects on screens. By learning this system, we develop essential mathematical skills and understand how numerical relationships can describe positions, patterns, and real-world situations.
3. What are the main components of the Cartesian coordinate system?
The main components of the Cartesian coordinate system are the x-axis, y-axis, origin, coordinates, and coordinate plane. The x-axis is the horizontal reference line, while the y-axis is the vertical reference line. The origin is their intersection point, represented by (0, 0). Coordinates describe the position of a point using numerical values, usually written as an ordered pair (x, y). The coordinate plane is the flat surface formed by the two axes. Together, these components help us plot points, identify their locations, represent geometric figures, and draw mathematical graphs accurately.
4. What is the origin in the Cartesian coordinate system?
The origin is the point where the x-axis and y-axis intersect in a two-dimensional Cartesian coordinate system. Its coordinates are always (0, 0), meaning that both the horizontal and vertical positions are zero. The origin serves as the reference point for locating every other point on the coordinate plane. To plot a point such as (3, 2), we begin at the origin, move three units to the right, and then move two units upward. Understanding the origin is essential because it helps determine coordinate values, distinguish positive and negative directions, and plot points correctly.
5. What are the four quadrants of the Cartesian coordinate plane?
The four quadrants are the regions created when the x-axis and y-axis divide the coordinate plane. They are numbered counterclockwise, beginning with the upper-right region. In the first quadrant, both coordinates are positive. In the second quadrant, x is negative and y is positive. In the third quadrant, both coordinates are negative. In the fourth quadrant, x is positive and y is negative. For example, (2, 3) lies in the first quadrant, while (-2, -3) lies in the third. Points located directly on either axis do not belong to any quadrant.
6. How do you plot a point on the Cartesian coordinate plane?
To plot a point, first locate the origin at (0, 0). Read the ordered pair carefully, remembering that the first value represents the horizontal position and the second represents the vertical position. For example, to plot (4, 2), move four units to the right along the horizontal direction, then move two units upward. Mark the resulting position with a dot. For negative coordinates, move left when x is negative and downward when y is negative. Always check the graph’s scale before plotting points to ensure that the position is accurate and the coordinates are interpreted correctly.
7. What is the difference between two-dimensional and three-dimensional Cartesian coordinates?
A two-dimensional Cartesian coordinate system uses two perpendicular axes, the x-axis and y-axis, to represent positions on a flat plane. Each point is described by an ordered pair (x, y). A three-dimensional Cartesian coordinate system includes an additional axis called the z-axis, allowing positions to be represented in space using three values, written as (x, y, z). Two-dimensional coordinates are commonly used for graphs, diagrams, and flat surfaces. Three-dimensional coordinates are useful in architecture, engineering, robotics, physics, and computer graphics, where objects have length, width, and height or occupy positions in three-dimensional space.
8. How is the Cartesian coordinate system used in everyday life?
The Cartesian coordinate system is used in many practical applications, especially when positions and relationships need to be represented numerically. Computer graphics use coordinates to position images and objects on screens. Engineers and architects apply coordinate-based methods when designing structures and creating technical drawings. Scientists use graphs to analyse experimental data and identify patterns. Robotics systems use coordinates to describe object positions and guide movement. Mapping applications also use coordinate-based representations, although geographic coordinates such as latitude and longitude differ from ordinary Cartesian coordinates. These applications demonstrate how coordinate systems support accurate measurement, visual representation, planning, and problem-solving.
9. How does the Cartesian coordinate system connect algebra and geometry?
The Cartesian coordinate system connects algebra and geometry by representing mathematical equations as points, lines, and curves on a coordinate plane. Algebra uses symbols and equations to describe relationships between quantities, while geometry studies shapes, positions, and spatial relationships. Coordinates bring these two areas together. For example, the equation y = 2x + 1 represents a straight line. By selecting values of x and calculating the corresponding values of y, we can obtain points and plot them on a graph. This connection makes it easier to understand equations visually, study functions, analyse geometric figures, and solve mathematical problems using both algebraic and graphical methods.
10. What common mistakes should beginners avoid when using Cartesian coordinates?
Beginners should avoid reversing the order of coordinates, confusing positive and negative directions, and ignoring the graph’s scale. In an ordered pair (x, y), the x-coordinate always comes first and represents the horizontal position, while the y-coordinate represents the vertical position. Positive x-values indicate movement to the right, and negative x-values indicate movement to the left. Positive y-values indicate upward movement, while negative y-values indicate downward movement. Another common mistake is assigning points on the axes to a quadrant. Points with either coordinate equal to zero lie directly on an axis and do not belong to any quadrant. Careful plotting improves accuracy.