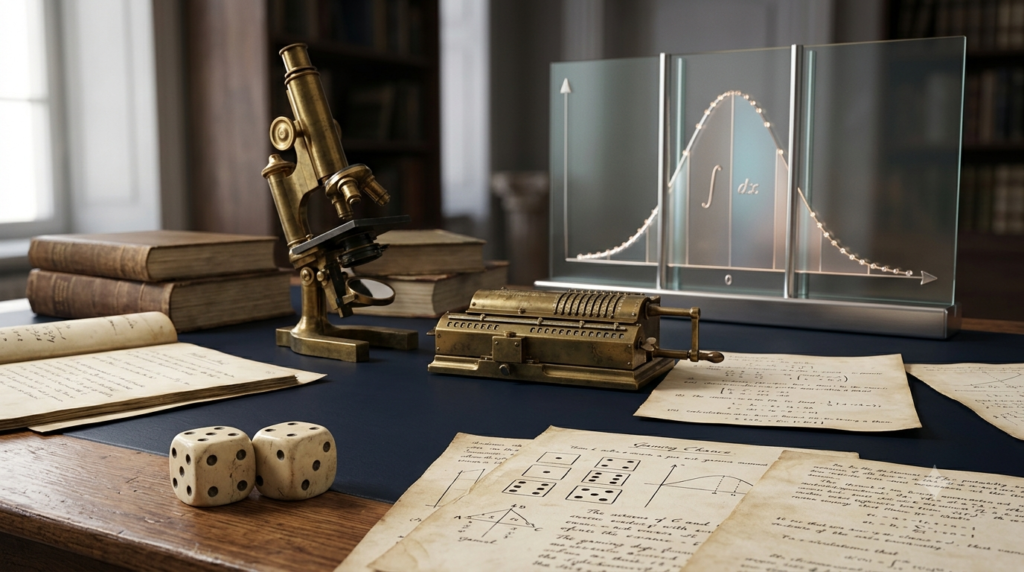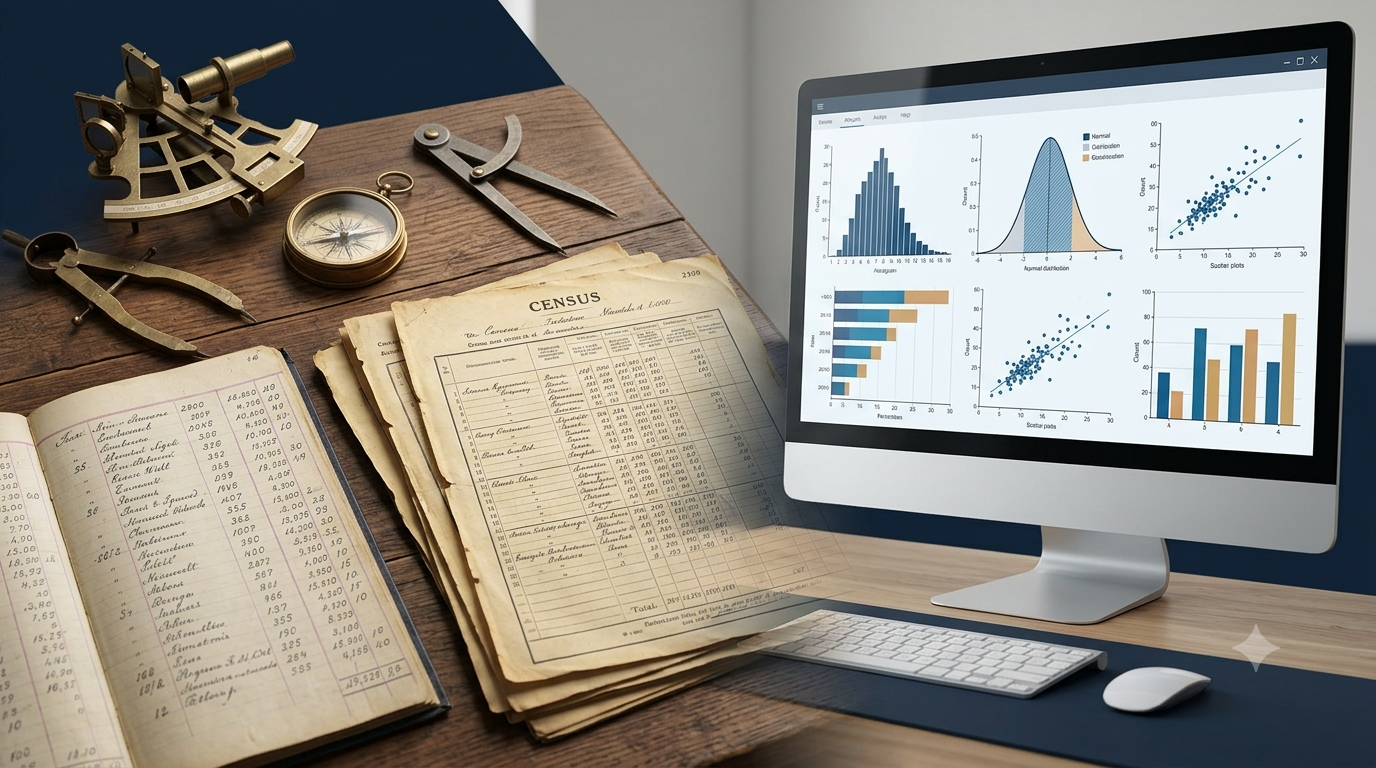
Statistics is an important branch of mathematics that helps us collect, organize, analyze, interpret, and present data. It allows people to understand information, identify patterns, compare results, and make informed decisions. Today, statistics is used in almost every field, including science, medicine, education, economics, business, technology, and government. However, statistics did not develop into its modern form in a single day. Its history began thousands of years ago when ancient civilizations recorded population numbers, agricultural production, taxes, and trade activities. Over time, these basic records developed into systematic methods of collecting and analyzing information. The introduction of probability theory, scientific experiments, mathematical models, and computers transformed statistics into a powerful analytical discipline. Understanding the history and development of statistics helps us appreciate how this field evolved and why it remains essential in the modern world.
What Is Statistics?
Statistics is the science of working with data to understand information and draw meaningful conclusions. It involves collecting data, organizing it into a useful form, presenting it through tables and graphs, analyzing it using mathematical methods, and interpreting the results.
For example, a school may collect students’ examination marks to calculate the average score and identify areas where students need additional support. Similarly, a hospital may analyze patient records to understand the effectiveness of a treatment.
Statistics is generally divided into two major branches.
Descriptive Statistics
Descriptive statistics focuses on summarizing and presenting collected data. It uses measures such as the mean, median, and mode, along with tables, charts, and graphs.
For example, calculating the average marks of a class is an application of descriptive statistics.
Inferential Statistics
Inferential statistics uses information from a sample to draw conclusions about a larger population. It includes methods such as estimation, hypothesis testing, and confidence intervals.
For example, researchers may study a sample of voters to estimate the voting preferences of an entire population.
Both branches developed gradually as people discovered better ways to understand and interpret information.
The Beginning of Statistics in Ancient Civilizations
Statistics in Ancient Egypt
Ancient Egypt was one of the earliest civilizations to maintain systematic records. Egyptian rulers and administrators needed information about land, agriculture, population, and wealth to manage their kingdom.
Records were used to estimate agricultural production, assess taxes, organize labor, and manage resources. Land measurements were especially important because the annual flooding of the Nile River could change the boundaries of agricultural fields.
These activities required counting, measurement, and recordkeeping. Although the Egyptians did not use statistics in the modern mathematical sense, their administrative practices established some of the earliest foundations for collecting and organizing data.
Statistics in Ancient Babylon
The Babylonians developed advanced recordkeeping practices, particularly in agriculture, trade, astronomy, and mathematics. They recorded quantities of goods, property transactions, and other economic activities on clay tablets.
Their observations of celestial bodies also helped establish traditions of systematic data recording. By maintaining records over time, Babylonian scholars could identify recurring patterns in astronomical events.
These practices demonstrated the value of collecting observations and comparing information to understand the world.
Statistics in Ancient China
Ancient China also developed important traditions of administrative data collection. Chinese rulers used population records, land information, agricultural statistics, and tax records to manage their territories.
Population counts helped governments understand the number of people under their administration and organize public responsibilities. Records of crops and resources supported planning and taxation.
These early practices show that statistics initially developed mainly from practical needs rather than abstract mathematical theories.
Statistics in Ancient India
Ancient India had a long tradition of administration, mathematics, trade, and recordkeeping. Information about land, agriculture, revenue, and population was important for managing kingdoms and economic activities.
The Arthashastra, traditionally attributed to Kautilya, discusses aspects of administration, taxation, agriculture, trade, and state management. Such administrative concerns illustrate the importance of reliable information in governing a large territory.
India also made major contributions to mathematics, including the development and use of the decimal place-value system and zero. These mathematical advances later became important tools for numerical calculations used in statistics.
During different historical periods, Indian rulers and administrators maintained records for taxation, land management, and public administration. These activities contributed to the broader history of collecting and using numerical information.
The Development of Statistics During the Middle Ages
During the Middle Ages, recordkeeping continued to develop in different parts of the world. Governments, religious institutions, merchants, and landowners collected information for administration, trade, taxation, and property management.
In Europe, land surveys and population-related records helped rulers understand the resources available within their territories. One famous example is the Domesday Book, completed in England in 1086 under William the Conqueror. It recorded information about landholdings, property, resources, and taxable wealth.
Such records were not statistical analyses in the modern sense, but they demonstrated the importance of systematically documenting information.
Trade also encouraged the development of accounting and numerical methods. Merchants needed accurate records of purchases, sales, debts, and profits. Improved arithmetic and bookkeeping practices made it easier to organize financial information and compare economic results.
During this period, statistics remained closely connected to administration and practical recordkeeping. The mathematical study of uncertainty had not yet developed into a formal discipline.
The Emergence of Modern Statistics in the 16th and 17th Centuries
The 16th and 17th centuries marked an important transition in the history of statistics. Governments continued to collect administrative information, while scholars began investigating patterns in births, deaths, population, and games of chance.
These developments helped establish the foundations of modern statistical reasoning.
The Development of Vital Statistics
Vital statistics refers to numerical information about important life events, such as births, deaths, marriages, and population changes.
As cities grew, records of births and deaths became increasingly valuable for understanding population patterns. Such records eventually helped researchers investigate life expectancy, mortality rates, and the effects of disease.
The systematic analysis of these records became an important step toward applying numerical methods to social and public health questions.
John Graunt and the Study of Population Data
John Graunt was an English statistician and one of the pioneers of demographic analysis. In 1662, he published Natural and Political Observations Made upon the Bills of Mortality.
Graunt examined records of births and deaths in London. Instead of simply listing the numbers, he searched for patterns and relationships in the available information.
His work included observations about mortality, population characteristics, and the frequency of different causes of death. He demonstrated that numerical records could provide useful insights into society.
Graunt’s research is widely regarded as a landmark in the development of demography and the systematic analysis of population data.
William Petty and Political Arithmetic
William Petty, an English economist and scholar, helped develop an approach known as political arithmetic. This approach involved using numerical information to study population, national wealth, taxation, and economic conditions.
Petty believed that social and economic questions could be examined through measurable evidence rather than relying entirely on opinions or descriptions.
Political arithmetic helped establish a connection between numerical data and the study of society. It also contributed to the historical development of economics, demography, and government statistics.
The Development of Probability Theory
One of the most important advances in the history of statistics was the development of probability theory.
Probability is the mathematical study of uncertainty. It helps us estimate how likely an event is to occur. Probability theory eventually provided the foundation for many statistical methods used to analyze uncertain events and make predictions.
Blaise Pascal and Pierre de Fermat
In the 17th century, French mathematicians Blaise Pascal and Pierre de Fermat made important contributions to probability theory.
Their correspondence in 1654 examined problems involving games of chance, including how to divide winnings fairly when a game ends before completion.
These problems encouraged mathematicians to develop systematic methods for calculating the likelihood of different outcomes. Their work is commonly recognized as a major milestone in the development of probability theory.
Christiaan Huygens
Dutch mathematician Christiaan Huygens further developed early probability theory. In 1657, he published a work on reasoning involving games of chance.
Huygens helped formalize the mathematical treatment of uncertain outcomes. His work made probability more systematic and contributed to its development as a mathematical subject.
Jacob Bernoulli
Jacob Bernoulli made another major contribution through his work on probability. His book Ars Conjectandi, published posthumously in 1713, included important ideas about repeated trials and long-term patterns.
Bernoulli’s work helped establish the principle that, under appropriate conditions, observed proportions tend to approach their theoretical probabilities as the number of trials increases.
This idea became an important foundation for statistical reasoning, especially when drawing conclusions from repeated observations.
The Expansion of Statistics in the 18th Century
During the 18th century, statistics became increasingly connected with mathematics, government administration, economics, and the study of populations.
The term statistics developed from the idea of information about the state and its affairs. In its early usage, it was strongly associated with describing the population, resources, and administrative characteristics of countries.
Governments collected information about population size, agriculture, trade, taxation, and military resources. Scholars began comparing such information across regions and periods.
At the same time, mathematicians expanded probability theory and developed methods that later became essential to statistical analysis.
Thomas Bayes and Bayesian Reasoning
Thomas Bayes was an English mathematician whose work contributed to the development of Bayesian probability.
His essay on solving a problem in the doctrine of chances was published posthumously in 1763. It presented an approach to reasoning about unknown probabilities using observed evidence.
Bayesian reasoning provides a way to update beliefs or probability estimates when new information becomes available. It is now widely used in scientific research, medical decision-making, machine learning, and data analysis.
Pierre-Simon Laplace
Pierre-Simon Laplace was a French mathematician who made major contributions to probability theory and mathematical statistics.
He developed and extended methods for applying probability to scientific and social questions. His work helped establish a stronger mathematical foundation for statistical reasoning.
Laplace also contributed to the development of methods for estimating unknown quantities from observations. His ideas influenced later research in astronomy, physics, and other scientific fields.
The Development of Statistical Methods in the 19th Century
The 19th century was a major period of growth for statistics. Researchers began developing mathematical tools to study relationships between variables, summarize data, measure uncertainty, and draw conclusions from observations.
Statistics increasingly became part of scientific research rather than remaining mainly a tool for government administration.
Carl Friedrich Gauss and the Normal Distribution
Carl Friedrich Gauss was a German mathematician who contributed to the development of the normal distribution and the method of least squares.
The normal distribution is a symmetrical, bell-shaped probability distribution that appears in many statistical models. Under appropriate conditions, it can describe the variation of measurements and other numerical quantities.
The method of least squares provides a way to estimate unknown parameters by minimizing the sum of squared differences between observed values and predicted values.
Gauss helped popularize and develop these methods in the context of astronomy and measurement. They later became essential tools in scientific data analysis.
Adolphe Quetelet and Social Statistics
Adolphe Quetelet was a Belgian astronomer and statistician who applied statistical methods to the study of human populations and social behavior.
He analyzed information about crime, birth rates, mortality, and other social characteristics. His work helped establish social statistics as an important field of investigation.
Quetelet also popularized the concept of the average person as a way of describing patterns within populations. Although modern researchers recognize that averages cannot fully represent individual differences, his work encouraged systematic quantitative research into society.
Francis Galton and Correlation
Francis Galton was an English scientist who made important contributions to the development of correlation and regression.
Correlation measures the strength and direction of an association between two variables. Regression methods help describe relationships between variables and estimate how one variable changes in relation to another.
Galton’s research into inherited characteristics helped stimulate the development of these methods. Later statisticians refined them and expanded their applications.
Today, correlation and regression are widely used in economics, biology, medicine, education, and business. However, correlation alone does not establish that one variable causes changes in another.
The Development of Modern Statistics in the 20th Century
The 20th century transformed statistics into a highly developed mathematical and scientific discipline. Researchers established more rigorous methods for designing experiments, testing hypotheses, estimating parameters, and analyzing complex data.
Statistical techniques became central to agriculture, medicine, psychology, engineering, economics, and industrial quality control.
Karl Pearson and Mathematical Statistics
Karl Pearson was a British mathematician who made major contributions to mathematical statistics.
He helped develop methods for measuring correlation, analyzing distributions, and testing relationships in data. The Pearson correlation coefficient became an important measure of linear association between two numerical variables.
Pearson also contributed to the development of the chi-square test, which is used in certain settings to compare observed data with expected patterns.
His work helped establish mathematical statistics as a more systematic field of study.
Ronald A. Fisher and Experimental Design
Ronald A. Fisher was a British statistician who made influential contributions to experimental design, analysis of variance, and statistical inference.
Experimental design involves planning experiments so that their results can provide reliable evidence. Analysis of variance, commonly called ANOVA, helps compare the means of multiple groups under suitable assumptions.
Fisher also helped popularize the use of randomization in experiments. Random assignment can reduce systematic differences between groups and strengthen the conclusions drawn from a study.
These ideas became particularly important in agricultural research, medicine, and scientific experimentation.
Jerzy Neyman and Egon Pearson
Jerzy Neyman and Egon Pearson made important contributions to the theory of statistical hypothesis testing.
Hypothesis testing provides a framework for evaluating evidence about a claim concerning a population or statistical model. Their work helped develop concepts such as alternative hypotheses, Type I errors, Type II errors, and the power of a statistical test.
These concepts are now widely used in clinical research, scientific studies, industrial testing, and many other fields.
The Growth of Sampling Methods
As populations and data collections became larger, researchers increasingly relied on sampling rather than examining every individual or item.
Sampling involves selecting a subset of a population to obtain information about the whole population. Properly designed samples can save time and money while providing useful estimates.
Random sampling, stratified sampling, and cluster sampling became important techniques in surveys, public health studies, market research, and government statistics.
The development of sampling theory made it possible to study large populations more efficiently while also providing methods to quantify uncertainty.
The Computer Revolution and the Development of Statistics
The introduction of electronic computers during the 20th century greatly expanded the possibilities of statistical analysis.
Before computers, many statistical calculations required lengthy manual work. As computing technology improved, researchers could analyze larger datasets, perform complicated calculations, and build more sophisticated statistical models.
Computers also supported the development of statistical software, making advanced analytical techniques accessible to researchers, businesses, and students.
Statistical computing became particularly important for analyzing medical records, economic indicators, scientific measurements, survey responses, and industrial data.
The combination of mathematical theory and computing power helped transform statistics into a practical tool for solving complex real-world problems.
Statistics in the 21st Century
In the 21st century, statistics has become more important than ever because organizations collect enormous amounts of information from digital systems, scientific instruments, online activities, and connected devices.
Modern statistical methods help people turn this information into useful knowledge.
Big Data and Data Science
Big data refers to datasets that are large, complex, or rapidly generated and may require specialized tools to process and analyze.
Data science combines statistics, computing, subject knowledge, and analytical methods to extract useful information from data.
Statistical techniques help identify patterns, estimate relationships, evaluate predictions, and distinguish meaningful signals from random variation.
For example, businesses analyze customer behavior to improve services, while scientists examine large datasets to study environmental changes and biological processes.
Artificial Intelligence and Machine Learning
Artificial intelligence and machine learning have created new opportunities for statistical analysis.
Machine learning systems use data to identify patterns and make predictions. Many methods rely on statistical ideas involving probability, estimation, optimization, and uncertainty.
Applications include image recognition, language processing, fraud detection, recommendation systems, and medical image analysis.
Statistics also helps researchers evaluate the performance of machine learning models, compare predictions with actual outcomes, and identify limitations in the available data.
Statistics in Medicine and Public Health
Statistics plays an essential role in modern medicine. Researchers use it to design clinical trials, evaluate treatments, estimate disease risks, and examine the safety and effectiveness of medical interventions.
During disease outbreaks, public health authorities analyze case numbers, hospital admissions, mortality rates, and other indicators to understand how an illness spreads.
Statistical methods also help identify uncertainty and evaluate whether observed differences are likely to reflect real effects or random variation.
Reliable statistical analysis supports evidence-based healthcare and more informed public health decisions.
Statistics in Business and Economics
Businesses use statistics to forecast demand, understand customer preferences, monitor product quality, and evaluate performance.
Economists analyze inflation, employment, income, production, and economic growth using statistical data.
Governments use population estimates and household surveys to plan infrastructure, education, healthcare, and other public services.
In these fields, statistics supports planning and decision-making, although conclusions must always account for data quality, assumptions, and uncertainty.
The Importance of Statistics Throughout History
The development of statistics shows how a practical need for information gradually became a scientific discipline.
Its importance can be understood through several key contributions.
Better decision-making: Statistics helps individuals and organizations make decisions based on evidence rather than assumptions alone.
Scientific discoveries: Researchers use statistical methods to analyze experiments and evaluate scientific claims.
Population studies: Demographic statistics help governments understand population changes, birth rates, mortality, and migration.
Economic planning: Statistical information supports the analysis of employment, prices, production, and economic development.
Healthcare improvements: Statistical analysis helps evaluate treatments and identify patterns in diseases.
Technology and innovation: Modern data analysis supports artificial intelligence, machine learning, and predictive systems.
Quality control: Industries use statistics to monitor production and identify problems in manufacturing processes.
However, statistics must be used carefully. Incorrect data, biased samples, misleading graphs, and inappropriate analytical methods can produce unreliable conclusions. Statistical results should therefore be interpreted in context and with an understanding of their limitations.
Conclusion
The history and development of statistics reflect humanity’s growing need to understand information and make better decisions. Early civilizations used numerical records to manage populations, land, agriculture, and taxation. During the 17th century, pioneers such as John Graunt helped establish systematic population analysis, while Pascal, Fermat, and other mathematicians developed the foundations of probability theory. In the 18th and 19th centuries, statistical thinking expanded through mathematical research and the study of social and scientific data. The 20th century introduced modern statistical inference, experimental design, sampling methods, and computer-based analysis. Today, statistics is an essential part of data science, artificial intelligence, medicine, economics, and countless other fields. Its continued development demonstrates that collecting information is only the beginning; the real value lies in analyzing evidence carefully and using it to understand the world.
FAQs
1. What is the history of statistics?
The history of statistics explains how people developed methods to collect, organize, analyze, and interpret numerical information. Its origins date back thousands of years when ancient civilizations recorded population numbers, agricultural production, taxes, and trade. During the 17th century, researchers began analyzing population records systematically, while mathematicians developed probability theory. In the 18th and 19th centuries, statistical methods became more mathematical and scientific. The 20th century introduced modern statistical inference, experimental design, and computer-based analysis. Today, statistics is widely used in science, medicine, economics, business, education, and technology to support informed decisions.
2. Who is known as the father of statistics?
There is no single universally accepted father of statistics because the discipline developed through the contributions of many scholars. However, Gottfried Achenwall is often associated with the introduction and development of the term statistics in 18th-century Germany. John Graunt is widely recognized as a pioneer of demographic statistics because he analyzed birth and death records in London in 1662. Karl Pearson and Ronald A. Fisher also played important roles in developing modern statistical methods. Each contributed to a different stage in the evolution of statistics, from government records and population studies to mathematical analysis and experimental research.
3. When did statistics first begin?
Statistics began in its earliest form thousands of years ago when ancient civilizations collected numerical information for administrative purposes. Ancient Egypt, Babylon, China, and India maintained records related to populations, land, agriculture, trade, and taxation. These early practices were not statistics in the modern mathematical sense, but they established the foundation for systematic data collection. Statistics gradually developed into a scientific discipline during the 17th and 18th centuries, when scholars began analyzing population records and studying probability. Later mathematical discoveries transformed these early recordkeeping practices into the modern methods used to understand and interpret data.
4. What was the contribution of John Graunt to statistics?
John Graunt was an English researcher who made an important contribution to the development of demographic statistics. In 1662, he published a study analyzing London’s Bills of Mortality, which contained records of births and deaths. Instead of simply listing the figures, Graunt examined them to identify patterns in mortality and population characteristics. His work demonstrated that numerical records could provide meaningful information about society. He also showed how data could support observations about population changes and public health. Graunt is widely regarded as one of the pioneers of population statistics and an important figure in the early history of statistical analysis.
5. How did probability theory contribute to the development of statistics?
Probability theory provided statistics with a mathematical foundation for studying uncertainty. During the 17th century, Blaise Pascal and Pierre de Fermat investigated mathematical problems involving games of chance. Their work helped establish systematic methods for calculating probabilities. Later, scholars such as Jacob Bernoulli and Pierre-Simon Laplace expanded these ideas. Probability theory eventually became essential for estimating unknown quantities, testing hypotheses, and drawing conclusions from samples. Modern statistical methods use probability to measure uncertainty and evaluate evidence. Today, probability is important in scientific research, weather forecasting, insurance, medicine, financial modeling, and machine learning.
6. How did statistics develop during the 19th century?
During the 19th century, statistics expanded from government recordkeeping into a more mathematical and scientific discipline. Researchers developed methods for studying population characteristics, measuring relationships between variables, and analyzing observations. Carl Friedrich Gauss contributed to the development of the normal distribution and the method of least squares. Adolphe Quetelet applied statistical methods to social data, while Francis Galton helped develop ideas related to correlation and regression. These advances allowed researchers to investigate patterns in human behavior, scientific measurements, and natural phenomena. The developments of this period established important foundations for modern statistical analysis.
7. What are the major developments in modern statistics?
Modern statistics developed through advances in mathematical theory, experimental research, sampling, and computing. During the 20th century, Karl Pearson contributed to correlation analysis and statistical testing, while Ronald A. Fisher advanced experimental design and analysis of variance. Jerzy Neyman and Egon Pearson contributed to the theory of hypothesis testing. Researchers also developed systematic sampling methods to study large populations efficiently. The introduction of computers made complex statistical calculations faster and more accessible. In the 21st century, statistics has expanded further through big data, data science, and machine learning, helping researchers analyze increasingly complex information.
8. What is the difference between traditional and modern statistics?
Traditional statistics primarily involved collecting numerical records for administration, taxation, population studies, and economic planning. Early methods focused on counting, classifying, summarizing, and comparing information. Modern statistics includes these activities but also uses advanced mathematical models, probability theory, hypothesis testing, regression analysis, and computer-based techniques. It supports scientific experiments, predictions, and decisions under uncertainty. Modern statistical analysis can process large datasets and examine complex relationships between variables. Although technology has transformed the field, the basic purpose remains the same: to extract meaningful information from data and use evidence to answer questions reliably.
9. How have computers changed the field of statistics?
Computers have transformed statistics by making data processing and complex calculations much faster and more efficient. Before electronic computers became widely available, researchers often performed statistical calculations manually, which required considerable time and effort. Modern computers can analyze millions of observations, create graphs, estimate statistical models, and perform simulations within a short period. Statistical software has also made advanced techniques accessible to researchers, students, businesses, and governments. Today, computers support big data analysis, machine learning, scientific research, and forecasting. However, reliable results still depend on appropriate methods, accurate data, and careful interpretation rather than computing power alone.
10. Why is the history of statistics important?
Studying the history of statistics helps us understand how methods for analyzing information developed over time. It shows how practical activities such as counting populations and recording taxes gradually led to mathematical techniques for studying uncertainty and drawing conclusions from data. Learning about historical contributors also helps explain the origins of probability theory, correlation, regression, experimental design, and statistical inference. This knowledge provides context for understanding modern analytical methods and their limitations. It also demonstrates why reliable data collection and careful interpretation are essential. Understanding this history helps students appreciate the role of statistics in science, technology, medicine, economics, and everyday decision-making.