Coordinate geometry is an important branch of mathematics that connects algebra with geometry. It helps us describe the exact position of points, understand shapes, and represent mathematical relationships using numbers and graphs. One of the first concepts to learn in coordinate geometry is the horizontal and vertical axes. These two lines form the foundation of the coordinate plane, also known as the Cartesian plane.
The horizontal axis is called the x-axis, while the vertical axis is called the y-axis. Together, they divide the plane into four regions and provide a systematic way to locate points using ordered pairs. Whether we are plotting a point, drawing a straight line, studying a geometric shape, or interpreting a scientific graph, understanding these axes is essential. In this article, we will explore their meanings, differences, properties, and practical applications with simple examples.
What Is Coordinate Geometry?
Coordinate geometry, also known as analytic geometry, is the study of geometric figures using coordinates and algebraic methods. Instead of describing a point only by its position in a drawing, coordinate geometry assigns numerical values to its location.
For example, a point can be described as being three units to the right of the origin and two units above it. This position can be represented by the ordered pair (3, 2).
Coordinates make mathematical problems easier to describe, calculate, and solve. They allow us to determine distances between points, identify midpoints, study straight lines, and analyze the properties of geometric shapes.
The coordinate plane is built around two perpendicular number lines: the horizontal x-axis and the vertical y-axis. Their intersection provides the starting point for measuring positions in the plane.
What Is the Horizontal Axis?
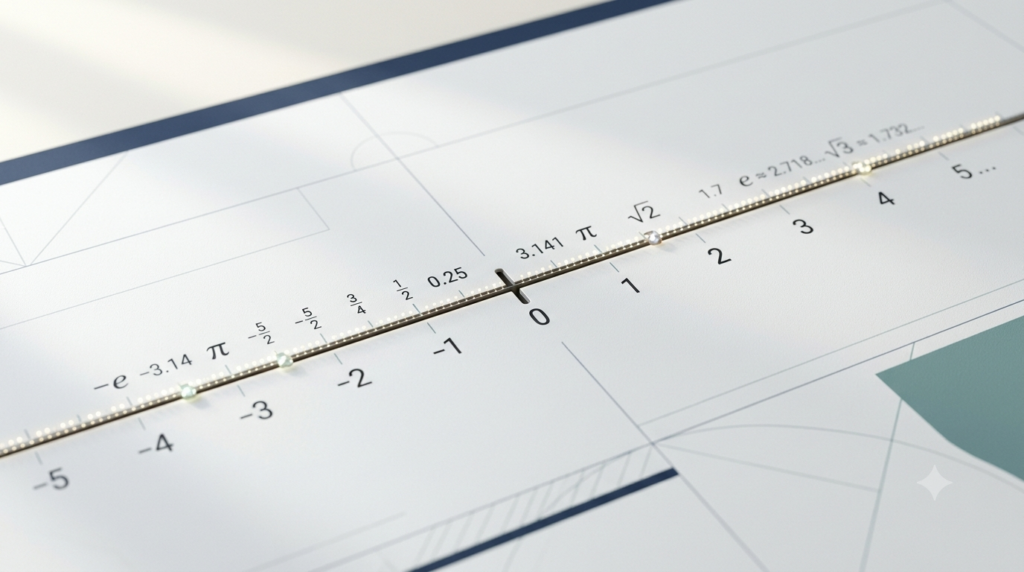
The horizontal axis is the number line that extends from left to right across the coordinate plane. It is called the x-axis and is used to represent the horizontal coordinate of a point.
The x-axis contains positive numbers on the right side of the origin and negative numbers on the left side. Moving to the right increases the x-coordinate, while moving to the left decreases it.
For example, a point with an x-coordinate of 4 is located four units to the right of the origin when its vertical coordinate is zero. Similarly, a point with an x-coordinate of −3 is three units to the left of the origin when its vertical coordinate is zero.
Direction of the X-Axis
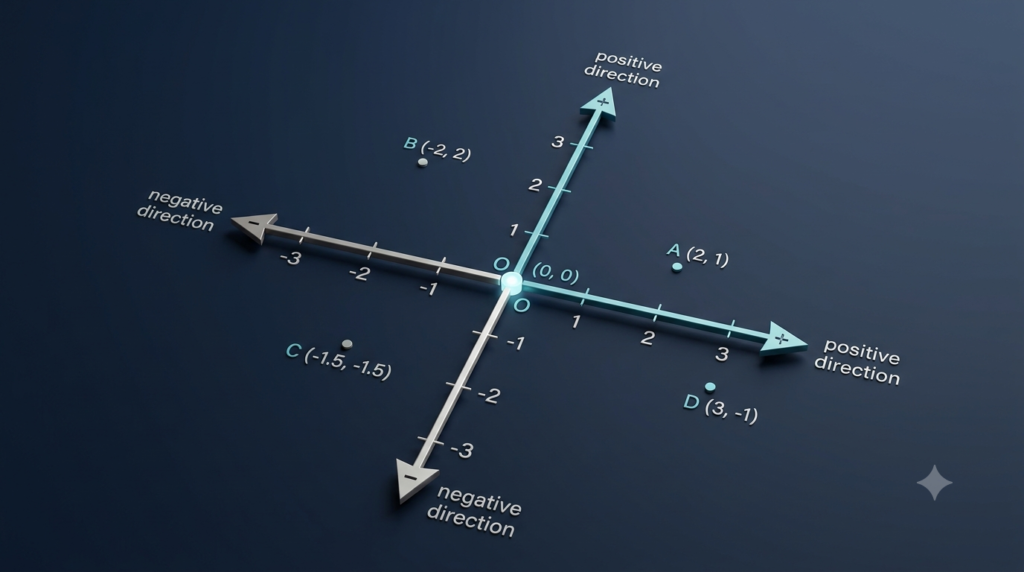
The horizontal axis has two main directions.
Positive x-direction: Moving from the origin toward the right.
Negative x-direction: Moving from the origin toward the left.
The positive direction is usually shown with an arrow pointing right, while the negative direction extends toward the left.
These directions help us understand how the horizontal position of a point changes. If the x-coordinate increases from 2 to 5 while the y-coordinate remains unchanged, the point moves three units to the right. If the x-coordinate decreases from 4 to 1, the point moves three units to the left.
Points Located on the X-Axis
Every point on the x-axis has a vertical coordinate equal to zero. This means that the point has no upward or downward displacement from the horizontal axis.
Text block — Formula:
y = 0
Examples of points on the x-axis include:
(2, 0)
(−4, 0)
(5, 0)
(0, 0)
The point (0, 0) is the origin, where both axes intersect.
A point such as (3, 0) lies three units to the right of the origin. A point such as (−5, 0) lies five units to the left. Both points remain on the horizontal axis because their y-coordinates are zero.
What Is the Vertical Axis?
The vertical axis is the number line that extends upward and downward through the coordinate plane. It is called the y-axis and represents the vertical coordinate of a point.
The y-axis contains positive numbers above the origin and negative numbers below it. Moving upward increases the y-coordinate, while moving downward decreases it.
For example, a point with a y-coordinate of 4 is four units above the origin when its horizontal coordinate is zero. A point with a y-coordinate of −3 is three units below the origin when its horizontal coordinate is zero.
Direction of the Y-Axis
The vertical axis has two main directions.
Positive y-direction: Moving upward from the origin.
Negative y-direction: Moving downward from the origin.
The positive direction is normally indicated by an arrow pointing upward, while the negative direction extends downward.
These directions help describe vertical movement. If the y-coordinate changes from 1 to 4 while the x-coordinate remains constant, the point moves three units upward. If the y-coordinate changes from 5 to 2, the point moves three units downward.
Points Located on the Y-Axis
Every point on the y-axis has a horizontal coordinate equal to zero. Such a point has no leftward or rightward displacement from the vertical axis.
Text block — Formula:
x = 0
Examples of points on the y-axis include:
(0, 3)
(0, −2)
(0, 5)
(0, 0)
For instance, the point (0, 4) lies four units above the origin. The point (0, −3) lies three units below the origin.
Both points belong to the y-axis because their x-coordinates are zero.
Understanding the Origin
The origin is the point where the horizontal x-axis and vertical y-axis intersect. It is the central reference point of the coordinate plane.
The coordinates of the origin are (0, 0). This means that the point has no horizontal or vertical displacement from the intersection of the axes.
Text block — Formula:
Origin = (0, 0)
The origin is important because all coordinates are measured relative to it. To locate a point, we determine how far it lies horizontally and vertically from this reference point.
For example, the point (4, 3) is located four units to the right and three units above the origin. The point (−2, −4) is located two units to the left and four units below it.
The origin also separates positive and negative values on both axes. It is neither positive nor negative; it represents zero in both directions.
How the Horizontal and Vertical Axes Work Together
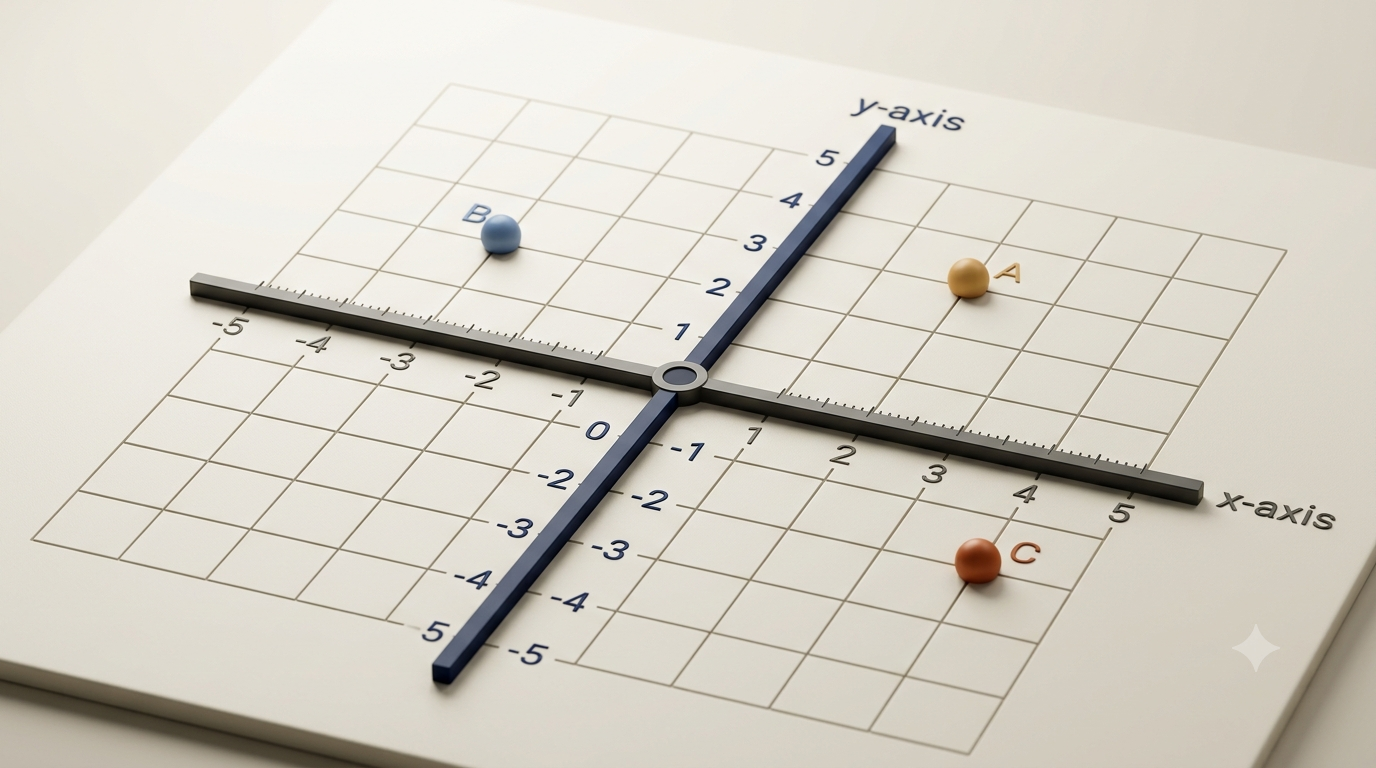
The x-axis and y-axis work together to identify the position of any point in a two-dimensional coordinate plane. Each point is represented by an ordered pair consisting of two numbers.
The first number represents the horizontal coordinate, called x. The second number represents the vertical coordinate, called y.
Text block — Formula:
Point = (x, y)
For example, consider the point (3, 2).
The first coordinate, 3, tells us to move three units to the right.
The second coordinate, 2, tells us to move two units upward.
The final position is the point (3, 2).
Now consider the point (−4, 2).
The first coordinate, −4, tells us to move four units to the left.
The second coordinate, 2, tells us to move two units upward.
The final position is the point (−4, 2).
The order of coordinates is extremely important. The points (3, 2) and (2, 3) are different because their horizontal and vertical positions are different.
When plotting a point, always read the x-coordinate first and the y-coordinate second.
Understanding the Four Quadrants
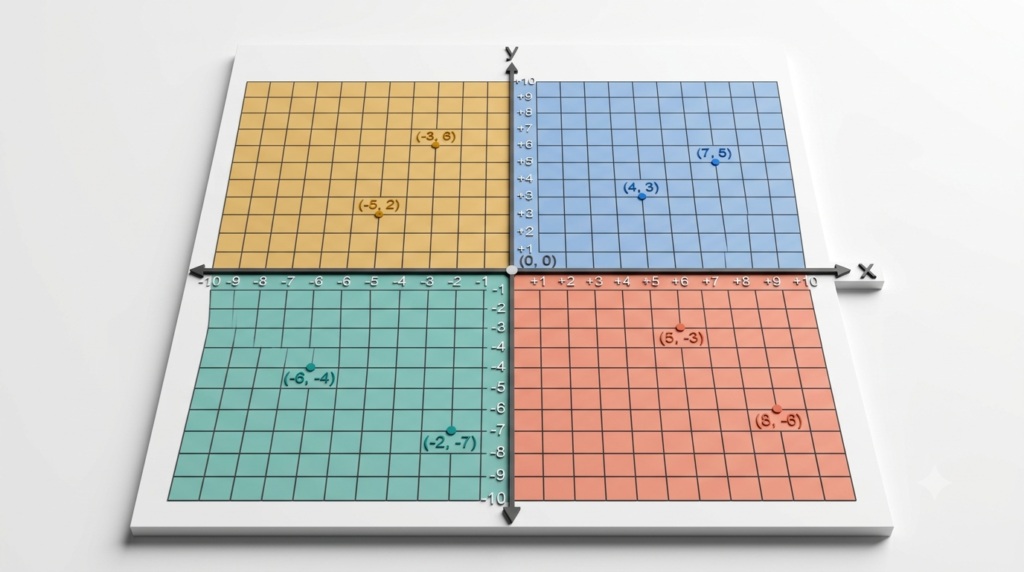
The horizontal and vertical axes divide the coordinate plane into four regions called quadrants. These quadrants are numbered counterclockwise, beginning with the upper-right region.
The signs of the x- and y-coordinates determine the quadrant in which a point is located.
First Quadrant
The first quadrant is located above the x-axis and to the right of the y-axis. Both coordinates are positive.
Text block — Coordinate signs:
x > 0 and y > 0
Examples include (2, 3), (5, 1), and (4, 6).
A point such as (2, 3) lies two units to the right and three units above the origin.
Second Quadrant
The second quadrant is located above the x-axis and to the left of the y-axis. The x-coordinate is negative, while the y-coordinate is positive.
Text block — Coordinate signs:
x < 0 and y > 0
Examples include (−2, 3), (−5, 1), and (−4, 6).
A point such as (−2, 3) lies two units to the left and three units above the origin.
Third Quadrant
The third quadrant is located below the x-axis and to the left of the y-axis. Both coordinates are negative.
Text block — Coordinate signs:
x < 0 and y < 0
Examples include (−2, −3), (−5, −1), and (−4, −6).
A point such as (−2, −3) lies two units to the left and three units below the origin.
Fourth Quadrant
The fourth quadrant is located below the x-axis and to the right of the y-axis. The x-coordinate is positive, while the y-coordinate is negative.
Text block — Coordinate signs:
x > 0 and y < 0
Examples include (2, −3), (5, −1), and (4, −6).
A point such as (2, −3) lies two units to the right and three units below the origin.
Points on the Axes Are Not in Any Quadrant
A point located directly on either axis does not belong to any of the four quadrants.
For example, (4, 0) lies on the x-axis, while (0, 4) lies on the y-axis. The origin, (0, 0), lies on both axes.
Remembering this distinction helps prevent common mistakes when identifying the location of points.
Differences Between the Horizontal and Vertical Axes
Although the two axes work together, they have different roles in representing coordinates.
The horizontal axis is the x-axis and measures horizontal position. Positive x-values extend to the right, and negative x-values extend to the left.
The vertical axis is the y-axis and measures vertical position. Positive y-values extend upward, and negative y-values extend downward.
The x-axis is horizontal, whereas the y-axis is vertical. They intersect at the origin and form a right angle of 90 degrees.
Another important difference concerns points located on each axis. Every point on the x-axis has a y-coordinate of zero. Every point on the y-axis has an x-coordinate of zero.
These properties make it easier to identify points and interpret graphs accurately.
How to Plot Points Using the Two Axes
Plotting points is one of the most important practical skills in coordinate geometry. The process becomes straightforward when the axes and coordinate order are understood.
Follow these steps to plot a point correctly.
Draw a horizontal line for the x-axis.
Draw a vertical line through its center for the y-axis.
Mark their intersection as the origin, (0, 0).
Choose a suitable scale and mark equal intervals along both axes.
Read the x-coordinate of the point.
Move horizontally from the origin in the direction indicated by the sign of x.
From that position, move vertically in the direction indicated by the sign of y.
Mark the final position and label it with its ordered pair.
Example 1: Plotting the Point (3, 2)
The point (3, 2) has a positive x-coordinate and a positive y-coordinate.
First, move three units to the right from the origin. Then move two units upward. Mark the resulting position.
The point lies in the first quadrant because both coordinates are positive.
Example 2: Plotting the Point (−4, 2)
The point (−4, 2) has a negative x-coordinate and a positive y-coordinate.
Move four units to the left from the origin. Then move two units upward and mark the position.
The point lies in the second quadrant.
Example 3: Plotting the Point (−3, −2)
The point (−3, −2) has two negative coordinates.
Move three units to the left from the origin. Then move two units downward and mark the position.
The point lies in the third quadrant.
Example 4: Plotting the Point (2, −4)
The point (2, −4) has a positive x-coordinate and a negative y-coordinate.
Move two units to the right from the origin. Then move four units downward.
The point lies in the fourth quadrant.
These examples demonstrate how the signs of the coordinates determine the direction of movement.
The Role of Scale on the Axes
A scale determines how numerical values are represented by distances along the axes. Choosing an appropriate scale is essential for creating accurate and readable graphs.
In a simple coordinate plane, one division may represent one unit. However, larger values may require a different scale.
For example, an axis might use one division to represent five units. In this case, the marks could represent 0, 5, 10, 15, and 20.
The scale does not change the coordinates themselves. It changes how those coordinates are displayed on the graph.
The horizontal and vertical axes do not always need to use the same numerical scale. However, when comparing distances or representing geometric shapes accurately, it is important to understand whether the scales differ.
Always read the scale before interpreting a graph. Incorrectly interpreting the intervals can lead to mistakes in locating points and measuring distances.
The Relationship Between the Axes and Straight Lines
The coordinate axes can also be understood through simple equations. These equations describe the positions of points that form the axes.
The horizontal x-axis consists of all points whose y-coordinate is zero.
Text block — Equation of the X-Axis:
y = 0
The vertical y-axis consists of all points whose x-coordinate is zero.
Text block — Equation of the Y-Axis:
x = 0
These equations are useful when studying straight lines and graphs. They show that every point on an axis shares one fixed coordinate.
For example, the point (−6, 0) satisfies the equation y = 0 and therefore lies on the x-axis. The point (0, 7) satisfies the equation x = 0 and lies on the y-axis.
The axes also provide reference lines for understanding the slopes and positions of other straight lines. A horizontal line has a constant y-coordinate, while a vertical line has a constant x-coordinate.
This relationship forms an important foundation for learning linear equations and graphing functions.
Real-Life Applications of the Horizontal and Vertical Axes
The horizontal and vertical axes are not limited to classroom mathematics. They are used in many practical situations to organize information and represent relationships.
Maps and Location Systems
Coordinate systems help identify locations on maps and digital grids. A simplified map may use horizontal and vertical coordinates to describe the position of a building, road, or landmark.
For example, a location could be identified by moving four units east and three units north from a reference point on a grid.
Real-world geographic systems use more advanced coordinate conventions, but the underlying idea of locating positions through coordinates is closely related.
Science and Experiments
Scientists often use graphs to study relationships between two quantities. One quantity is plotted along the horizontal axis, while another is plotted along the vertical axis.
For example, a physics graph may show time on the x-axis and distance on the y-axis. The graph helps researchers understand how distance changes as time passes.
In chemistry, a graph might represent temperature against time during an experiment. In biology, it could show how the number of organisms changes over several days.
The axes make measurements easier to compare and patterns easier to recognize.
Business and Economics
Businesses use coordinate graphs to compare sales, costs, production, and other measurements.
For instance, a company might place months along the horizontal axis and monthly sales along the vertical axis. The resulting graph can show whether sales are increasing, decreasing, or remaining stable.
Similarly, economists use graphs to represent relationships between quantities such as price and demand.
Computer Graphics and Game Development
Computer graphics rely on coordinate systems to position objects on screens. In a typical two-dimensional mathematical coordinate plane, positive y-values extend upward. However, many computer screen systems place the origin in the upper-left corner, with positive y-values increasing downward.
This difference is important when working with images, animations, and games.
Understanding the axes helps developers position characters, move objects, draw shapes, and calculate distances between screen locations.
Engineering and Architecture
Engineers and architects use coordinate systems to represent designs, measurements, and object positions. Two-dimensional plans can describe the locations of walls, doors, windows, and other components.
Coordinate geometry also supports computer-aided design, where precise numerical positions are essential for creating accurate drawings and models.
These applications show how a basic mathematical idea supports work across many fields.
Common Mistakes to Avoid
Beginners sometimes make small errors when working with the horizontal and vertical axes. Understanding these mistakes can improve accuracy.
Reversing the Coordinates
The ordered pair (3, 5) is not the same as (5, 3). Always read the x-coordinate first and the y-coordinate second.
Confusing Positive and Negative Directions
Positive x-values extend to the right, while negative x-values extend to the left. Positive y-values extend upward, while negative y-values extend downward in the standard mathematical coordinate plane.
Forgetting the Origin
The origin is always represented by (0, 0). It is the reference point from which coordinates are measured.
Placing Points on the Wrong Axis
A point with a y-coordinate of zero lies on the x-axis. A point with an x-coordinate of zero lies on the y-axis.
For example, (5, 0) is on the x-axis, not the y-axis. Likewise, (0, 5) is on the y-axis.
Ignoring the Scale
If each division represents two units rather than one, a point must be plotted according to that scale. Always check the intervals before plotting coordinates.
Assigning Axis Points to a Quadrant
Points that lie directly on an axis do not belong to any quadrant. Only points away from both axes belong to one of the four quadrants.
Conclusion
The horizontal and vertical axes are the basic building blocks of coordinate geometry. The horizontal x-axis represents horizontal position, while the vertical y-axis represents vertical position. Their intersection forms the origin, which provides the reference point for locating coordinates.
Together, these axes allow us to represent points using ordered pairs, identify the four quadrants, draw graphs, and study relationships between mathematical quantities. Their applications extend beyond mathematics into science, engineering, computer graphics, business, and everyday location systems.
By understanding the directions of positive and negative coordinates, learning how to plot points, and recognizing the equations of the axes, anyone can develop a strong foundation in coordinate geometry. These simple concepts prepare learners for more advanced topics, including straight lines, distance formulas, slopes, geometric transformations, and graphing functions.
FAQs
1. What are the horizontal and vertical axes in coordinate geometry?
The horizontal and vertical axes are two perpendicular number lines that form the coordinate plane. The horizontal axis is called the x-axis, and the vertical axis is called the y-axis. The x-axis represents horizontal positions, while the y-axis represents vertical positions. Both axes intersect at a point called the origin, which has coordinates (0, 0). These axes help us locate points using ordered pairs, such as (3, 2). They are essential for plotting graphs, studying geometric shapes, understanding mathematical relationships, and solving problems involving coordinates in mathematics and other scientific fields.
2. What is the difference between the x-axis and the y-axis?
The main difference between the x-axis and the y-axis is their direction and the coordinates they represent. The x-axis runs horizontally from left to right and represents horizontal positions. Positive x-values extend to the right, while negative x-values extend to the left. The y-axis runs vertically from bottom to top and represents vertical positions. Positive y-values extend upward, while negative y-values extend downward. Both axes intersect at the origin and form a right angle of 90 degrees. Together, they allow us to identify the exact position of points on a two-dimensional coordinate plane.
3. What is the origin in coordinate geometry?
The origin is the point where the horizontal x-axis and vertical y-axis intersect. It is represented by the coordinates (0, 0) because both the horizontal and vertical coordinates are zero. The origin serves as the reference point for locating other points on the coordinate plane. For example, the point (4, 3) is four units to the right and three units above the origin. Similarly, the point (−2, −3) is two units to the left and three units below it. Understanding the origin is essential for plotting points, interpreting graphs, and solving coordinate geometry problems accurately.
4. What are the coordinates of a point on the x-axis?
Every point on the x-axis has a y-coordinate equal to zero. This is because points on the horizontal axis have no vertical displacement from that axis. The general condition for a point to lie on the x-axis is y = 0. Examples include (2, 0), (−5, 0), and (7, 0). A point with a positive x-coordinate lies to the right of the origin, while a point with a negative x-coordinate lies to the left. The origin, (0, 0), also lies on the x-axis. These properties help identify horizontal positions on the coordinate plane.
5. What are the coordinates of a point on the y-axis?
Every point on the y-axis has an x-coordinate equal to zero because it has no horizontal displacement from the vertical axis. The general condition for a point to lie on the y-axis is x = 0. Examples include (0, 3), (0, −4), and (0, 6). Points with positive y-coordinates lie above the origin, while points with negative y-coordinates lie below it. The origin, (0, 0), also belongs to the y-axis. Recognizing this property makes it easier to distinguish points on the vertical axis from points located elsewhere in the coordinate plane.
6. How do you plot a point using the horizontal and vertical axes?
To plot a point, first identify its ordered pair, written as (x, y). Begin at the origin and read the x-coordinate first. Move right for a positive x-value or left for a negative x-value. Next, move upward for a positive y-value or downward for a negative y-value. Mark the final position and label the point. For example, to plot (3, −2), move three units right and then two units down. The point lies in the fourth quadrant. Always check the scale of the axes and remember that the first coordinate represents x and the second represents y.
7. How many quadrants are formed by the coordinate axes?
The horizontal x-axis and vertical y-axis divide the coordinate plane into four quadrants. The first quadrant contains points with positive x- and y-coordinates. The second quadrant contains negative x-coordinates and positive y-coordinates. The third quadrant contains negative x- and y-coordinates. The fourth quadrant contains positive x-coordinates and negative y-coordinates. Quadrants are numbered counterclockwise, starting from the upper-right region. Points located directly on either axis do not belong to any quadrant. Understanding the signs of coordinates helps identify the correct quadrant and makes plotting and interpreting points easier.
8. Why are the horizontal and vertical axes perpendicular?
The horizontal and vertical axes are perpendicular because they intersect at a right angle of 90 degrees. This arrangement creates a consistent reference system for measuring positions in two dimensions. The horizontal axis represents movement from left to right, while the vertical axis represents movement upward and downward. Because the axes are perpendicular, coordinates can describe these two directions independently. This structure makes it possible to locate points accurately, calculate distances, and represent geometric figures on a coordinate plane. The perpendicular relationship is also important in graphing equations, studying shapes, and understanding many mathematical and scientific models.
9. What are the equations of the horizontal and vertical axes?
The equation of the horizontal x-axis is y = 0 because every point on this axis has a vertical coordinate of zero. The equation of the vertical y-axis is x = 0 because every point on this axis has a horizontal coordinate of zero. For example, the point (5, 0) lies on the x-axis, while (0, 5) lies on the y-axis. Both equations describe straight lines passing through the origin. These simple equations are useful when learning about linear graphs, coordinate geometry, and algebra. They also help identify whether a given point belongs to either axis.
10. Where are the horizontal and vertical axes used in real life?
The horizontal and vertical axes are used in many real-life applications. Scientists use them to plot experimental results, such as distance against time or temperature against time. Businesses use coordinate graphs to compare monthly sales, costs, and production levels. Engineers and architects use coordinate systems to position objects and prepare technical drawings. Computer graphics and video games use coordinates to place and move objects on screens. Maps and grid systems also use coordinates to identify locations. Although some real-world systems use different orientations or more advanced coordinate methods, the basic idea remains the same: coordinates help describe positions and relationships accurately.